Author: Pyramid Indicators
-

Pick Your Field, Know Your Boundaries
Most people think trading is about doing more. More charts. More trades. More setups. But in my experience, that mindset leads to nothing but frustration, fatigue, and a confused account balance. The truth is, we don’t get paid to trade, we get paid to wait. And when the market gives us the right hand, we…
-
Keep It Simple: The Hidden Edge Most Traders Overlook
In trading, complexity is seductive. It feels like control, as if stacking more tools onto our charts somehow protects us from uncertainty. But the truth is, complexity often becomes a smokescreen. It disguises hesitation. It fragments our focus. And when real-time pressure hits, it tends to collapse under its own weight. Simplicity, by contrast, is…
-
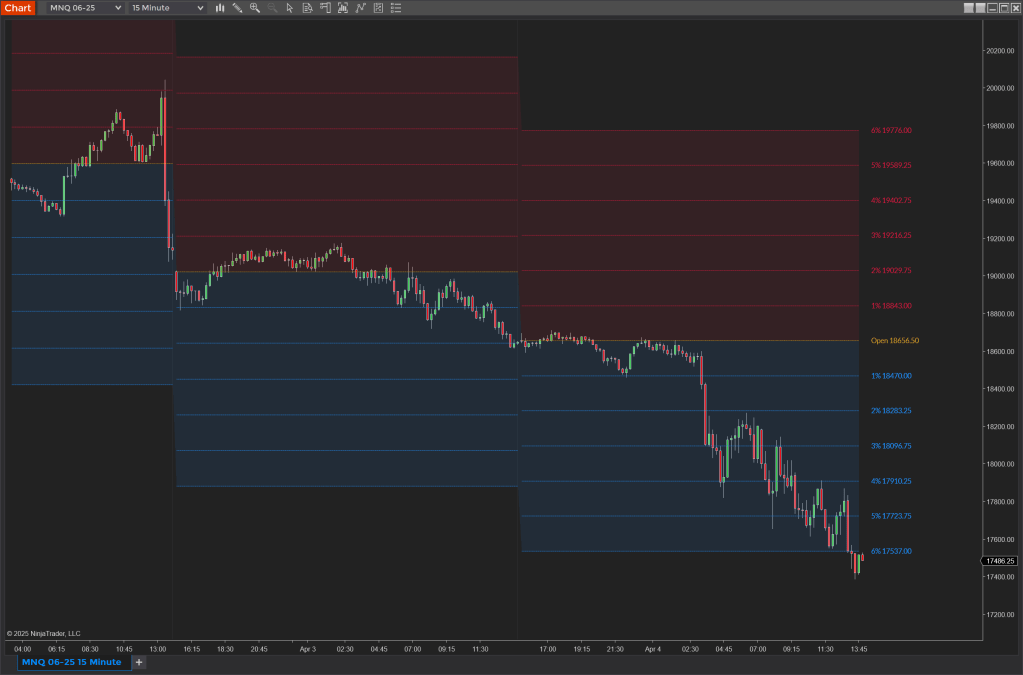
Navigating Big Moves with Precision: Understanding the Power of Percent-Based Pivots in Futures Day Trading
When you’re trading futures, you’re not just reacting to price, you’re making decisions in real time based on context. That’s what separates the professional from the casual participant. Every day brings new variables, but when you have a system that helps you quantify movement, you move from reacting emotionally to interpreting logically. And that’s where…
-

A Year-End Recap of Futures Markets
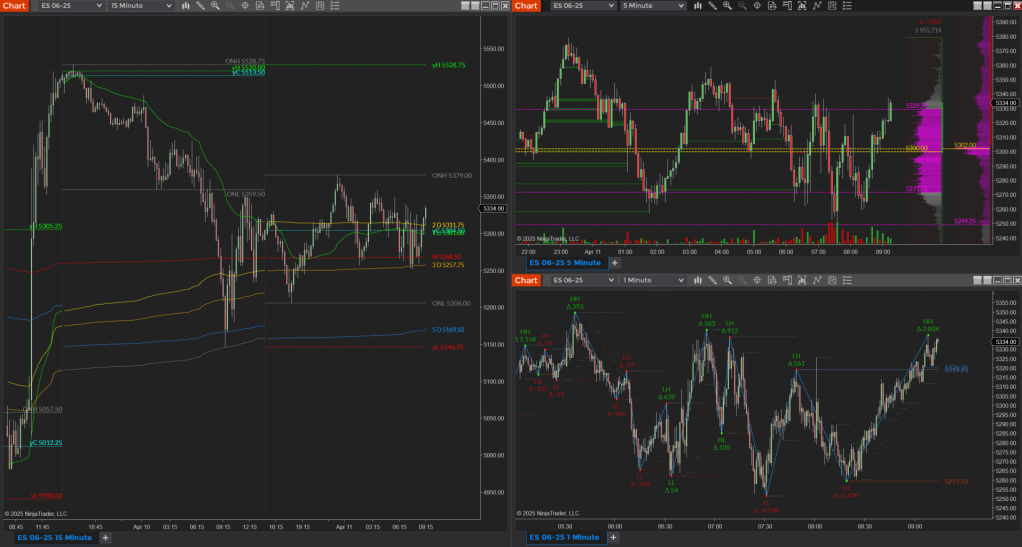
NQ 03-24 The average daily range spanned between 600 ticks on lower volatility days up to 1200 ticks on higher volatility days. The average daily volume spanned between 485K contracts exchanged on lower volatility days up to 775K on higher volatility days. When price is in a trend, and bars start to get smaller in…
-
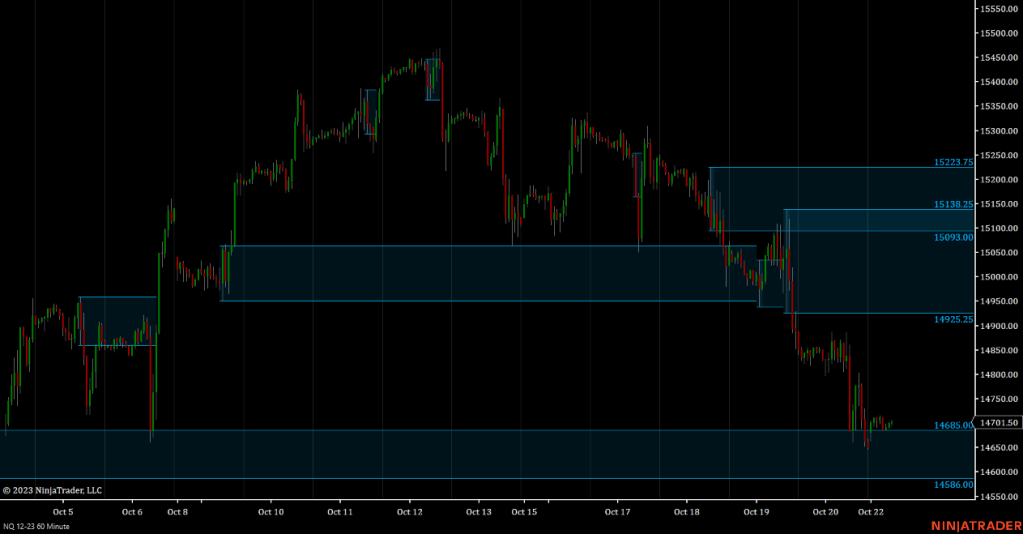
Mastering the Week Ahead – 10/23/2023
Analyzing NQ Futures Across Multiple Timeframes A picture is worth a thousand words, and when it comes to understanding price movements, a chart speaks volumes that mere text can’t capture. Key Indicators: Time-Frames: In trading, these charts and indicators are your visual guides. Use them to gain a quick yet comprehensive view of market dynamics.…
-
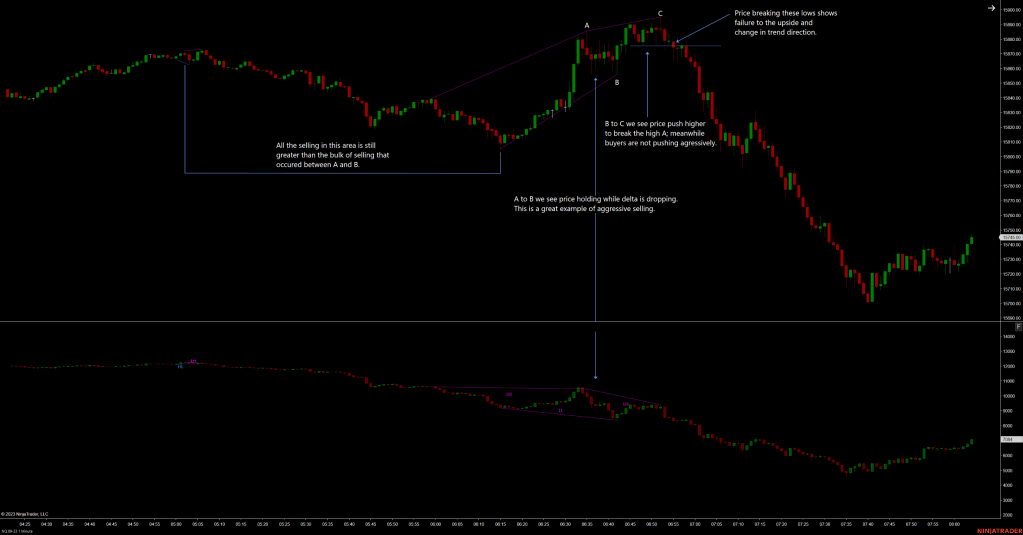
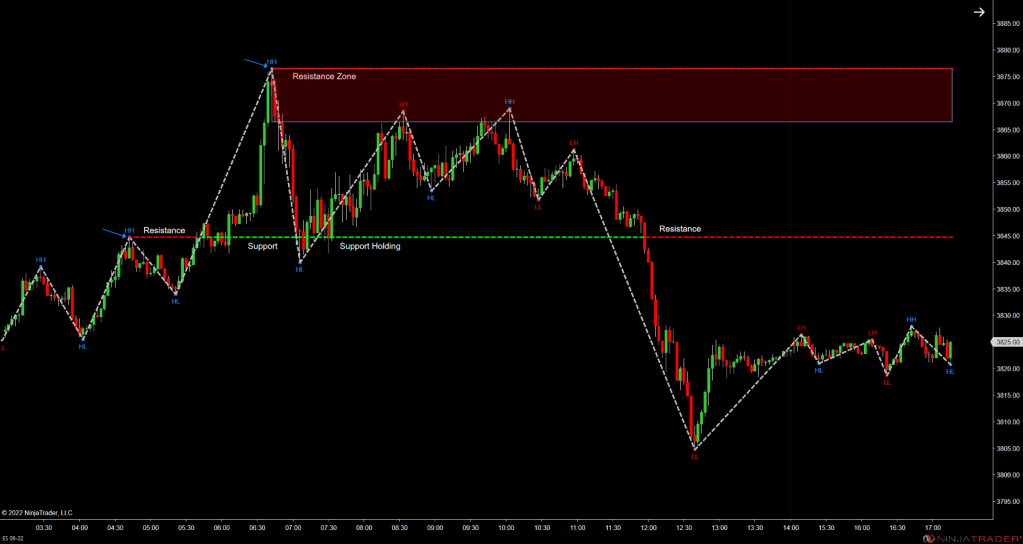
Delta Divergence – Set up and Price Action.
Today’s Emini-Nasdaq offered a great example of Delta Divergence creating a resistance zone as it accelerated into a support level at 15700. The example occurred on the 1-minute chart, which I’ve been using for my Volume Delta lately; however, the concept is applicable on all timeframes and markets given they offer suitable liquidity. Congestion is…
-

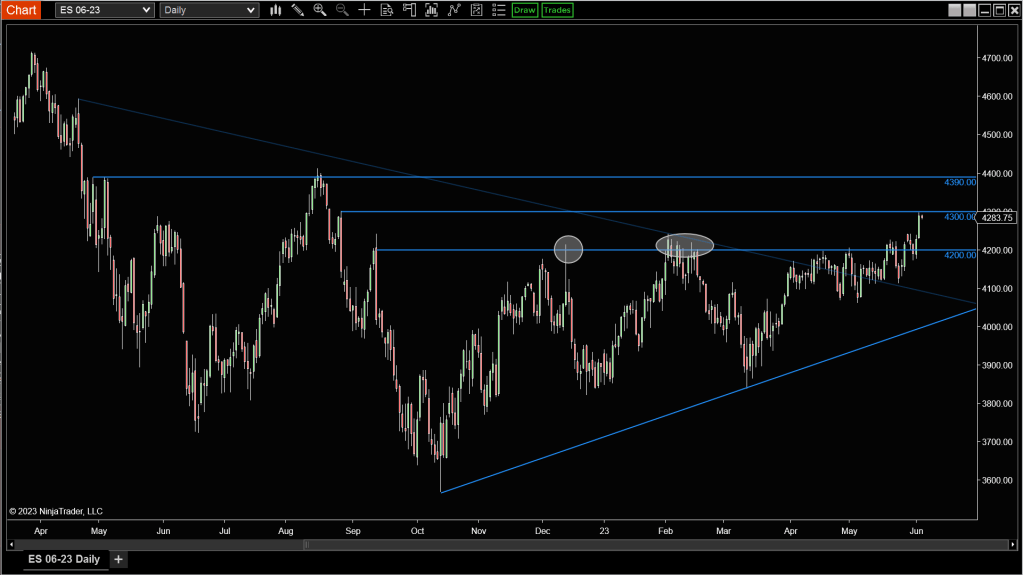
Pyramid – Week 06/12/2023 Analysis
Economic Calendar Economic Calendar for this week highlighting the important events to look out for. Monday: Treasury Statement.Tuesday: FOMC Meeting and CPI.Wednesday: PPI, EIA Petroleum, FOMC Announcement, and Fed press conference.Thursday: Jobless Claims, Phil Fed Man. Index, Retail Sales, Industrial Production, EIA Natural Gas, and Fed Balance Sheet.Friday: Consumer Sentiment. FOMC An eventful week ahead…
-
Pyramid – Week 06/05/2023 Analysis
Economic News Economic Calendar for this week highlighting the important events to look out for. Monday: Factory Orders and ISM Services Index. Tuesday: N/A. Wednesday: International Trade and EIA Petroleum. Thursday: Jobless Claims, EIA Natural Gas, Fed Balance Sheet. Friday: N/A. Rollover The week ahead is rollover week. As we approach contract expiration, we can…
-

Identifying Consolidation Zones
When supply and demand are nearly equal, price moves sideways. This sideways price action is called a consolidation zone. Above is a hand drawn rectangle over a consolidation zone on ES 12-22 5min. This usually happens before price continues its trend or reverses into a new trend. When the average range contracts over a period…
-
Support and Resistance Principles
It’s important to be able to identify Support and Resistance. Support acts as a floor preventing further downward movement.Resistance acts as a ceiling preventing further upward movement. Price movement relies on supply and demand: Areas of support and resistance are created by the decisions of market participants working in an uncertain environment. Decisions to buy…
