
NQ 03-24
The average daily range spanned between 600 ticks on lower volatility days up to 1200 ticks on higher volatility days.
The average daily volume spanned between 485K contracts exchanged on lower volatility days up to 775K on higher volatility days.
When price is in a trend, and bars start to get smaller in size, (having smaller ATRs), it generally signifies a weakening trend. But when you see a monster bar, you know there was volatility and possibility of trend continuation or reversal.
Tip: As the day is developing, try to predict how the day will play out. Will the range expand more or did the move happen overnight? How is the volume building up? Note your predictions and the more you practice this, the better you’ll get at it.
Duration
01/01/2023 thru 01/01/2024
Timeframe (Data Series)
Daily Bars
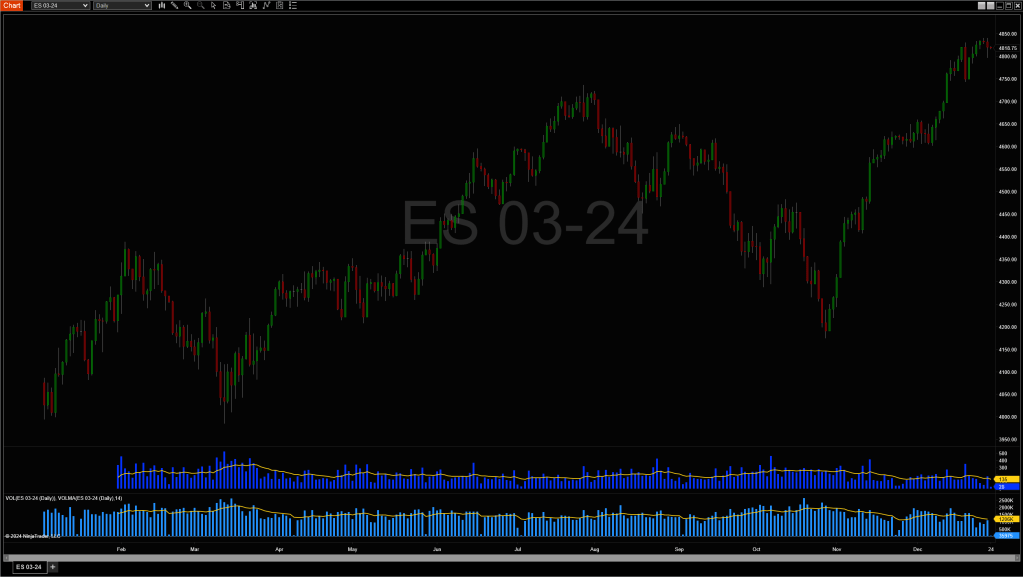
ES 03-24
The average daily range spanned between 130 ticks on lower volatility days up to 330 ticks on higher volatility days.
The average daily volume spanned between 1.15M contracts exchanged on lower volatility days up to 2M on higher volatility days.
Duration
01/01/2023 thru 01/01/2024
Timeframe (Data Series)
Daily Bars
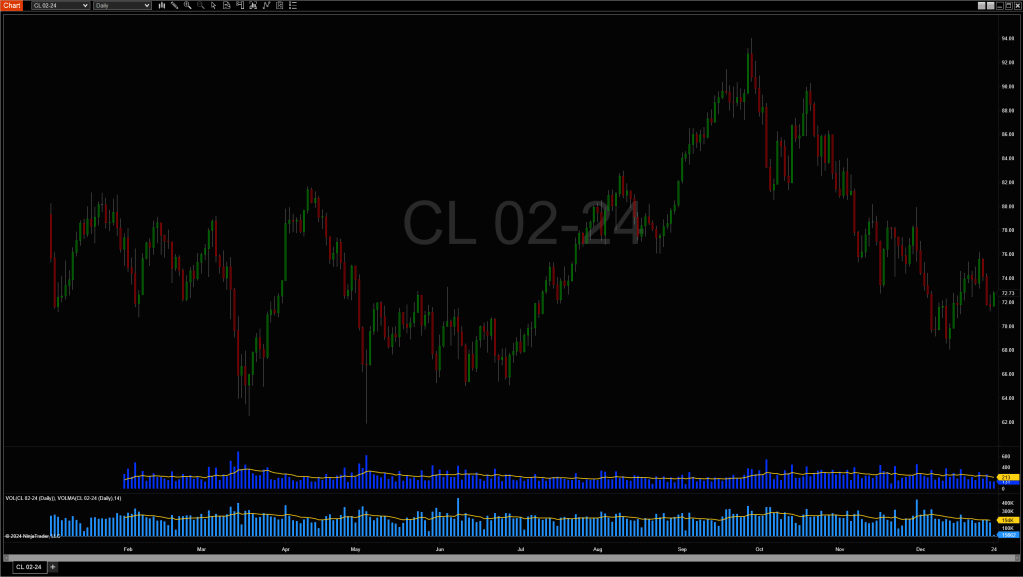
CL 02-24
The average daily range spanned between 180 ticks on lower volatility days up to 360 ticks on higher volatility days.
The average daily volume spanned between 200K contracts exchanged on lower volatility days up to 285K on higher volatility days.
Duration
01/01/2023 thru 01/01/2024
Timeframe (Data Series)
Daily Bars
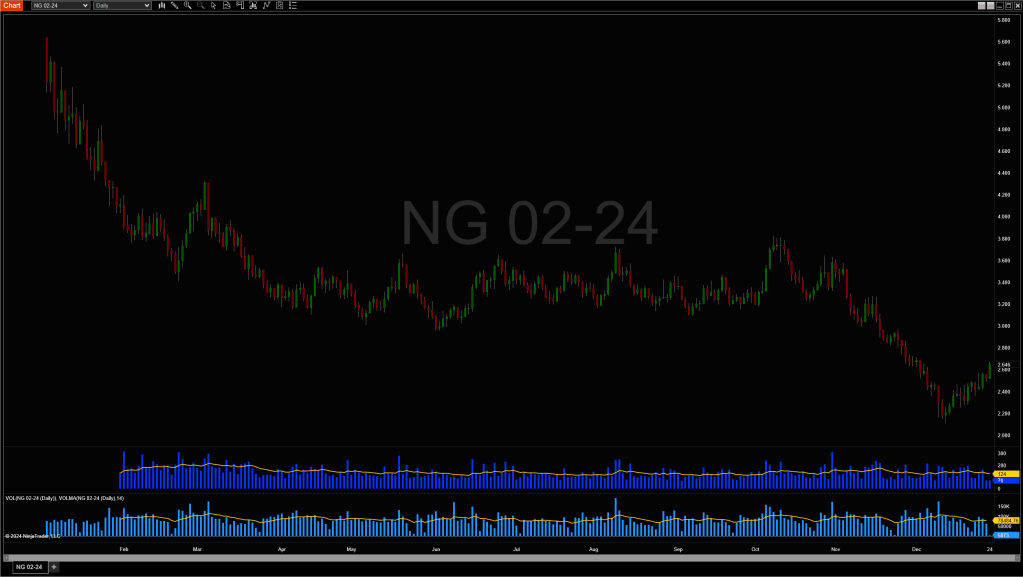
NG 02-24
The average daily range spanned between 120 ticks on lower volatility days up to 210 ticks on higher volatility days.
The average daily volume spanned between 65K contracts exchanged on lower volatility days up to 115K on higher volatility days.
Duration
01/01/2023 thru 01/01/2024
Timeframe (Data Series)
Daily Bars
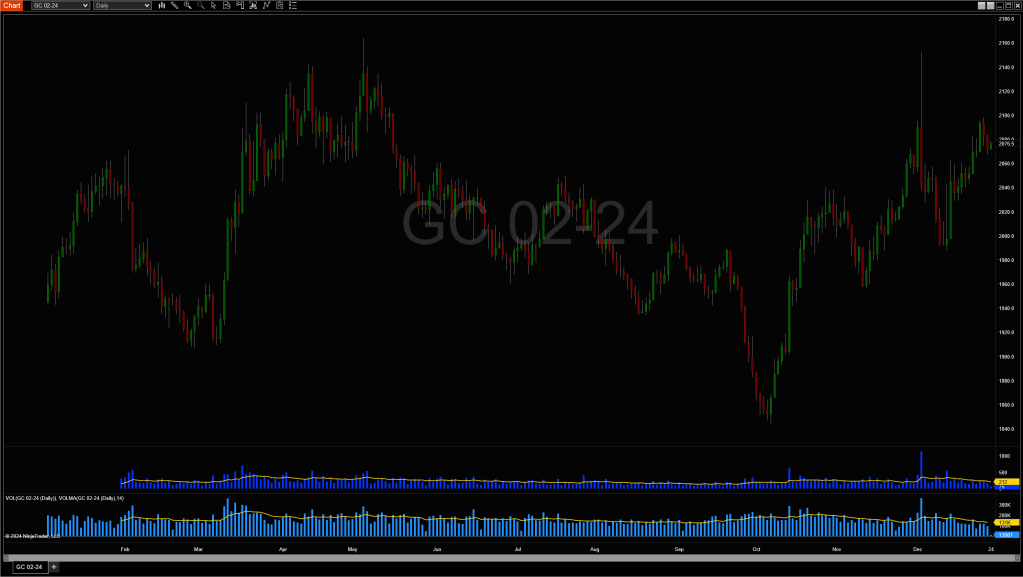
GC 02-24
The average daily range spanned between 150 ticks on lower volatility days up to 390 ticks on higher volatility days.
The average daily volume spanned between 130K contracts exchanged on lower volatility days up to 230K on higher volatility days.
Duration
01/01/2023 thru 01/01/2024
Timeframe (Data Series)
Daily Bars
