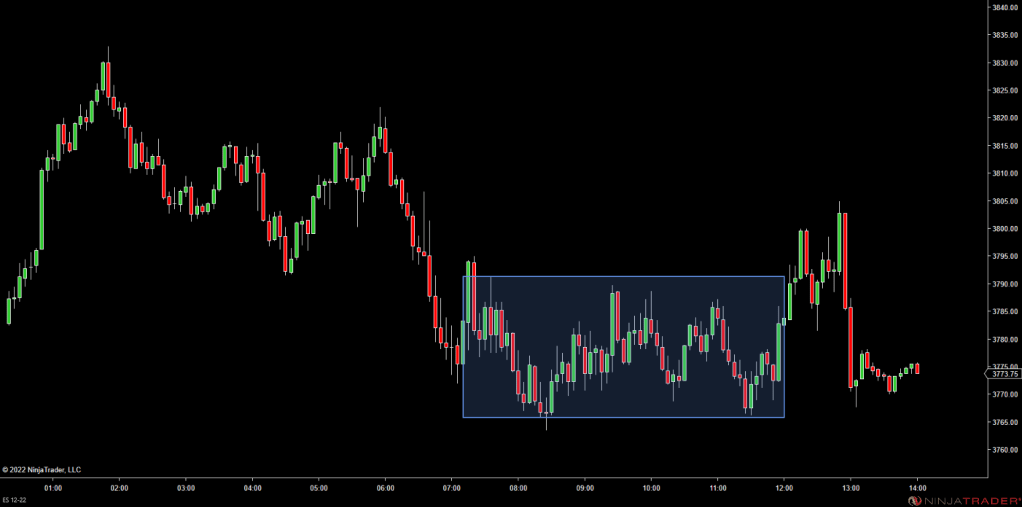
When supply and demand are nearly equal, price moves sideways. This sideways price action is called a consolidation zone. Above is a hand drawn rectangle over a consolidation zone on ES 12-22 5min. This usually happens before price continues its trend or reverses into a new trend.
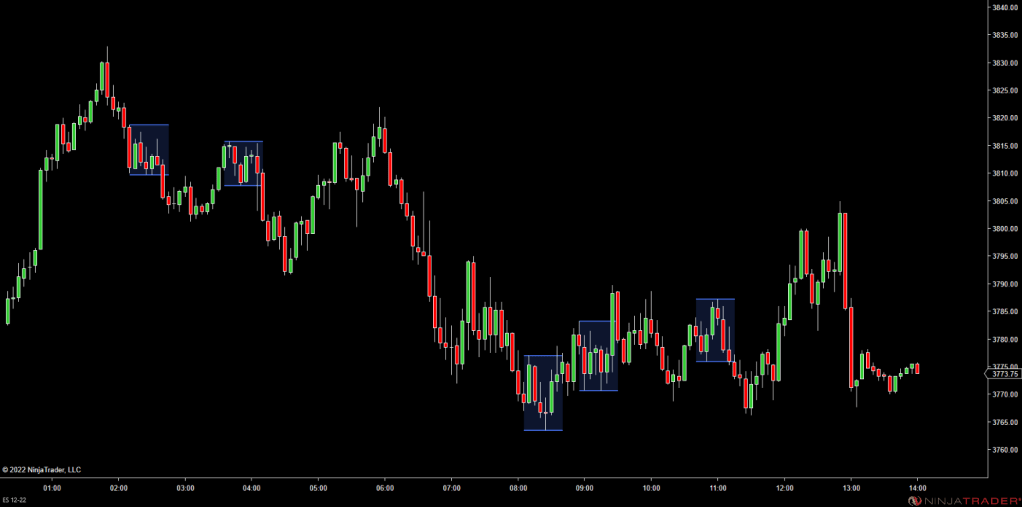
When the average range contracts over a period of time or bars, price tends to break out. Here is an example of the same chart showing multiple smaller consolidation zones spanning a minimum of 6 bars in length with a lower-than-average range.
Price Zone indicator aims at automatically identifying and highlighting zones between a range of prices over a minimum number of bars.
One should be actively analyzing what price is doing while trading, and not just trade based off an indicator signal. Here’s an example of price analysis: