When you’re trading futures, you’re not just reacting to price, you’re making decisions in real time based on context. That’s what separates the professional from the casual participant. Every day brings new variables, but when you have a system that helps you quantify movement, you move from reacting emotionally to interpreting logically. And that’s where percent-based pivots come in.
One of the tools I’ve found most useful, and that I’ve built into our Pivots Range indicator, is the ability to track price distance from the session open in percent terms. When volatility kicks in, you want to know how far we’ve gone, not just where we are. And percentage distance offers a standardized measure of movement that holds up across instruments and environments.
Putting Percentages into Practice
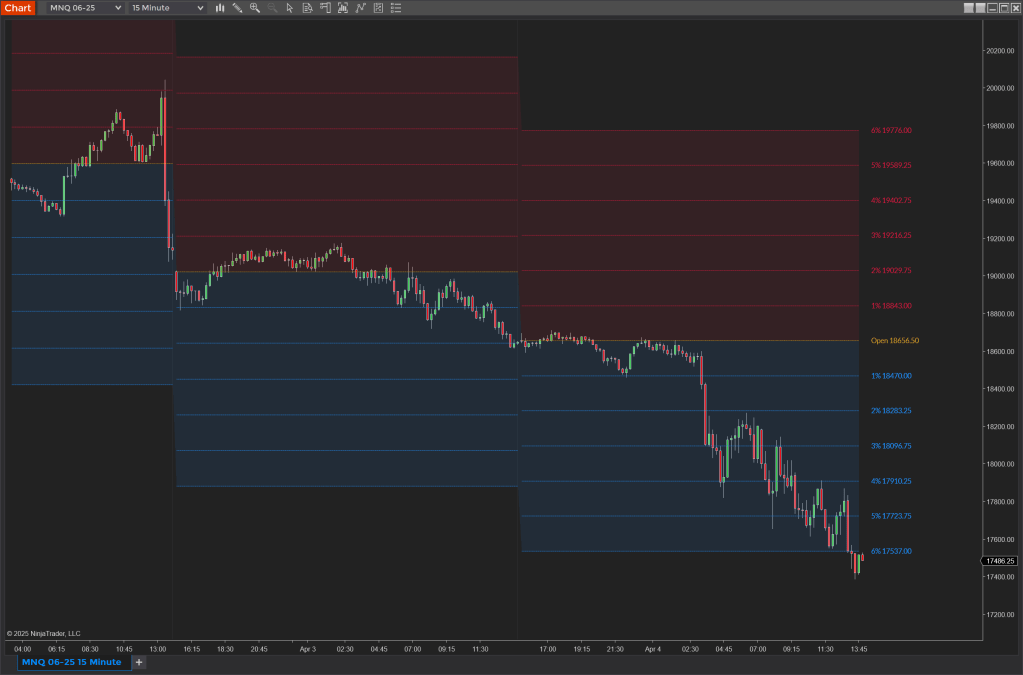
The chart above shows how this plays out on MNQ using the 15-minute timeframe. The levels are marked 1% through 6% from the session open. The reason I use percentages instead of arbitrary levels is simple, they’re scalable, and they help me contextualize price behavior in relation to how far a move has stretched relative to its origin.
This becomes especially relevant when you factor in circuit breakers. If you’re trading equity index futures, you should already know that a 7% move from the prior day’s close will halt the market for 15 minutes. The Pivots Range helps you track how close we are to these thresholds, not with guesswork, but with visual, data-driven clarity.
You’ll often find that price respects these percent levels, even intraday. A 2% push might be followed by temporary exhaustion. A 4% move can start to feel parabolic. By the time we get to 5% or 6%, we’re often deep into an extended trend, and those aren’t the areas to enter late. That’s when you start thinking about traps, reversals, and fading the extremes, if the context supports it.
The Day After a Monster Trend
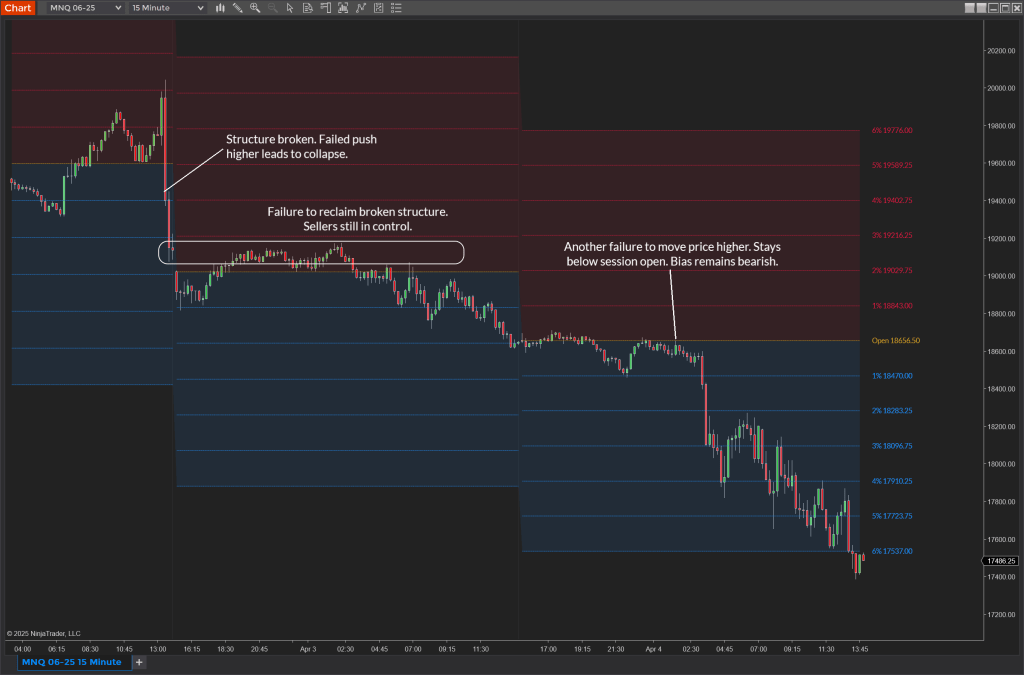
Big days don’t just leave behind big moves. They leave behind imbalances, emotionally charged positioning, broken structure, and usually, a trail of traders caught on the wrong side. The next session becomes less about continuation and more about resolution.
When the market has had a large directional day, where price drives and closes near the extreme, what follows is often a session that seeks to digest that move. That can show up as a balanced day, or in some cases, another directional day that squeezes the participants who tried to fade too early.
So, as a trader, the question you want to ask is: What’s unfinished from yesterday?
- Did we break major structure?
- Are there clear inefficiencies or untested levels left behind?
- Is today shaping up to be a low-energy session, or is momentum still pressing?
On days like this, I like to watch how the market behaves relative to the prior day’s range and to key percent levels. If the open is inside the previous range and we start to test extremes again, especially in the same direction, that’s often a signal that the imbalance hasn’t fully cleared. Conversely, if the market chops around near the midrange or traps early traders and rotates, it might be transitioning to a new structure.
The bottom line? The day after a monster trend isn’t random. It’s often a mirror reflecting yesterday’s emotion, uncertainty, and imbalance.
Professional Mindset: Don’t Trade Like You’re Guessing
A professional doesn’t hope the market will do something. A professional builds a framework, observes how price behaves within that structure, and adapts accordingly.
The percent-based pivots are one way to create that framework. They’re not magical. They don’t predict tops and bottoms. But they do help you read the character of the session.
Tip: Before the session starts, form a hypothesis. Is today likely to expand the range or hold within it? What are the odds that we revisit a 3% or 5% level? Write it down. Then, let the market prove or disprove it.
The more you do this, the more you train yourself to think like an analyst, not just a trader. And that shift, from acting on feelings to responding to context, is what builds consistency.
Final Thoughts
Our goal is to help traders make informed decisions, not based on gut feeling, but on structure, probability, and market context. Tools like the Pivots Range are designed with that in mind. They help you measure, observe, and react with clarity.
Every line you draw on your chart should serve a purpose. Percent pivots give you a dynamic, adaptable framework for understanding where price is relative to where it started, and how much fuel might be left in the tank.
The more structure you bring to your trading, the less you need to rely on hope. And that’s where the real power is.
