-
A Year-End Recap of Futures Markets
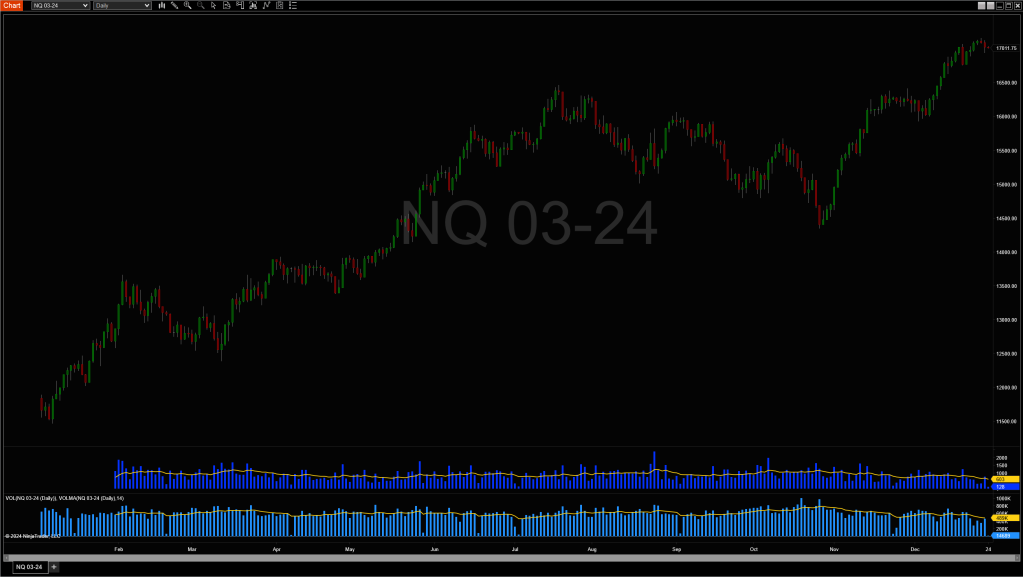
NQ 03-24 The average daily range spanned between 600 ticks on lower volatility days up to 1200 ticks on higher volatility days. The average daily volume spanned between 485K contracts exchanged on lower volatility days up to 775K on higher volatility days. When price is in a trend, and bars start to get smaller in… Read more
-
Mastering the Week Ahead – 10/23/2023
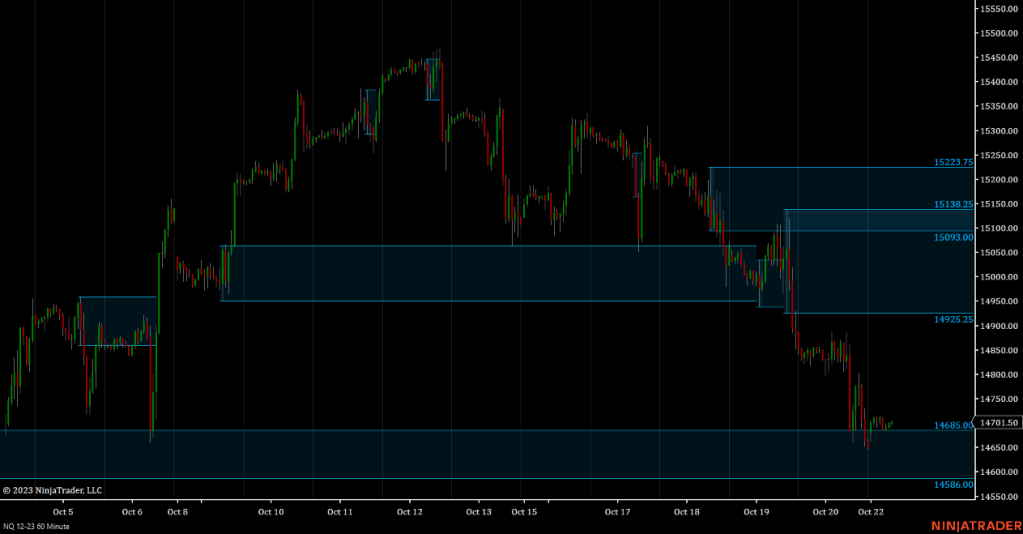
Analyzing NQ Futures Across Multiple Timeframes A picture is worth a thousand words, and when it comes to understanding price movements, a chart speaks volumes that mere text can’t capture. Key Indicators: Time-Frames: In trading, these charts and indicators are your visual guides. Use them to gain a quick yet comprehensive view of market dynamics.… Read more
-
Delta Divergence – Set up and Price Action.
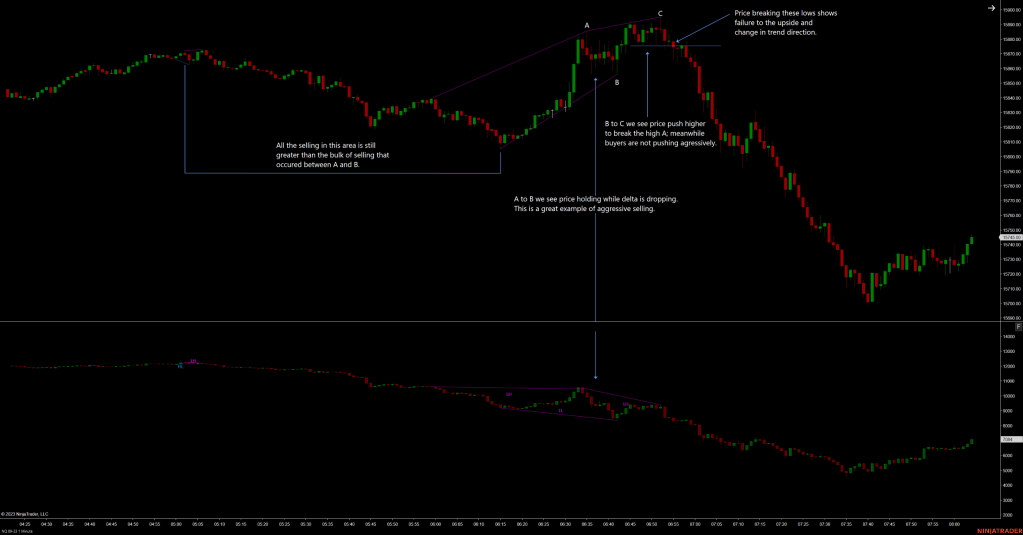
Today’s Emini-Nasdaq offered a great example of Delta Divergence creating a resistance zone as it accelerated into a support level at 15700. The example occurred on the 1-minute chart, which I’ve been using for my Volume Delta lately; however, the concept is applicable on all timeframes and markets given they offer suitable liquidity. Congestion is… Read more
-
Pyramid – Week 06/12/2023 Analysis
Economic Calendar Economic Calendar for this week highlighting the important events to look out for. Monday: Treasury Statement.Tuesday: FOMC Meeting and CPI.Wednesday: PPI, EIA Petroleum, FOMC Announcement, and Fed press conference.Thursday: Jobless Claims, Phil Fed Man. Index, Retail Sales, Industrial Production, EIA Natural Gas, and Fed Balance Sheet.Friday: Consumer Sentiment. FOMC An eventful week ahead… Read more
-

Pyramid – Week 06/05/2023 Analysis
Economic News Economic Calendar for this week highlighting the important events to look out for. Monday: Factory Orders and ISM Services Index. Tuesday: N/A. Wednesday: International Trade and EIA Petroleum. Thursday: Jobless Claims, EIA Natural Gas, Fed Balance Sheet. Friday: N/A. Rollover The week ahead is rollover week. As we approach contract expiration, we can… Read more
-

Identifying Consolidation Zones
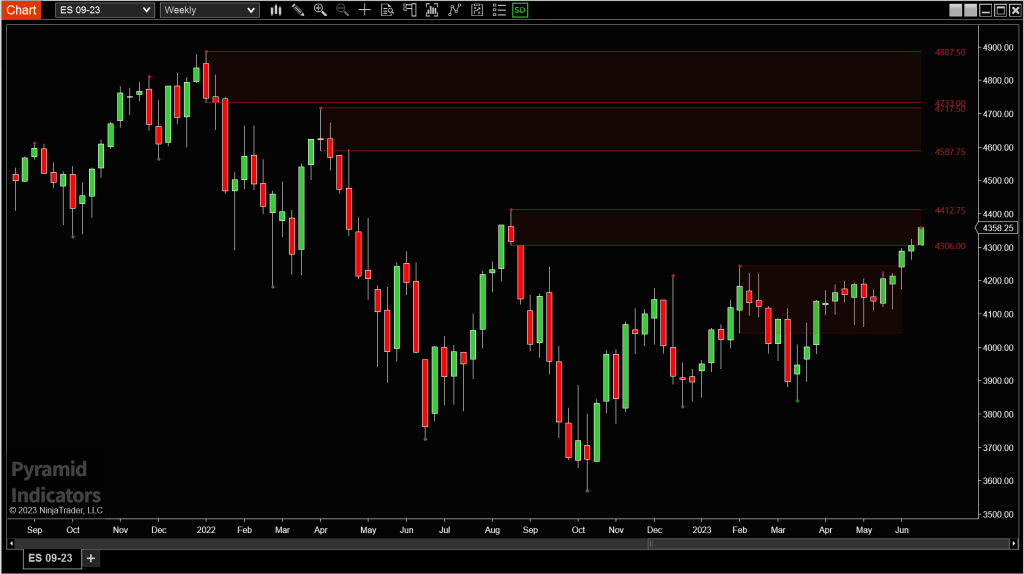
When supply and demand are nearly equal, price moves sideways. This sideways price action is called a consolidation zone. Above is a hand drawn rectangle over a consolidation zone on ES 12-22 5min. This usually happens before price continues its trend or reverses into a new trend. When the average range contracts over a period… Read more
-
Subscribe
Subscribed
Already have a WordPress.com account? Log in now.
