Analyzing NQ Futures Across Multiple Timeframes
A picture is worth a thousand words, and when it comes to understanding price movements, a chart speaks volumes that mere text can’t capture.
Key Indicators:
Time-Frames:
- Daily
- 120 Minutes
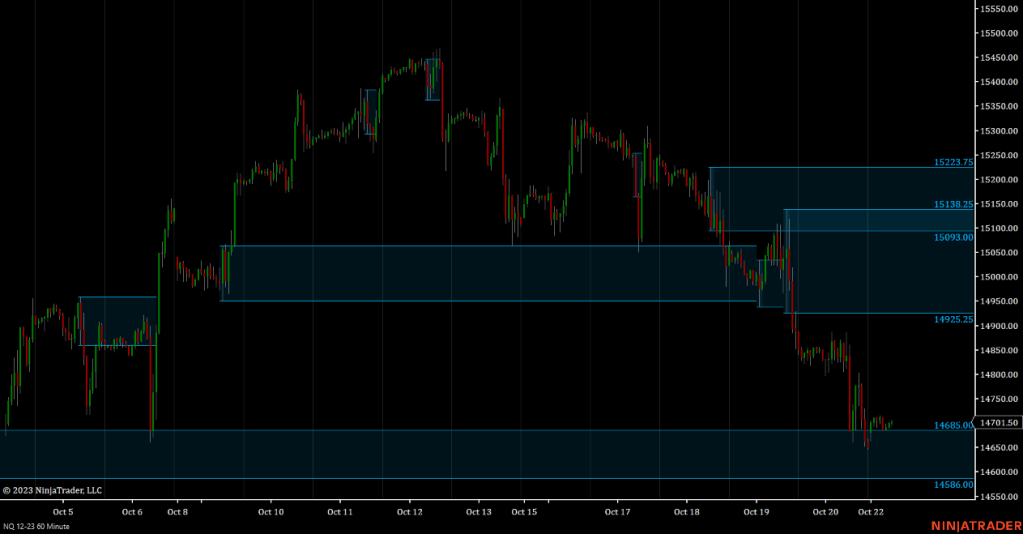
- 60 Minutes
- 15 Minutes
In trading, these charts and indicators are your visual guides. Use them to gain a quick yet comprehensive view of market dynamics. No need for lengthy explanations – let’s dive in.

Support @ 14665 – Toggle Buttons
NQ Daily
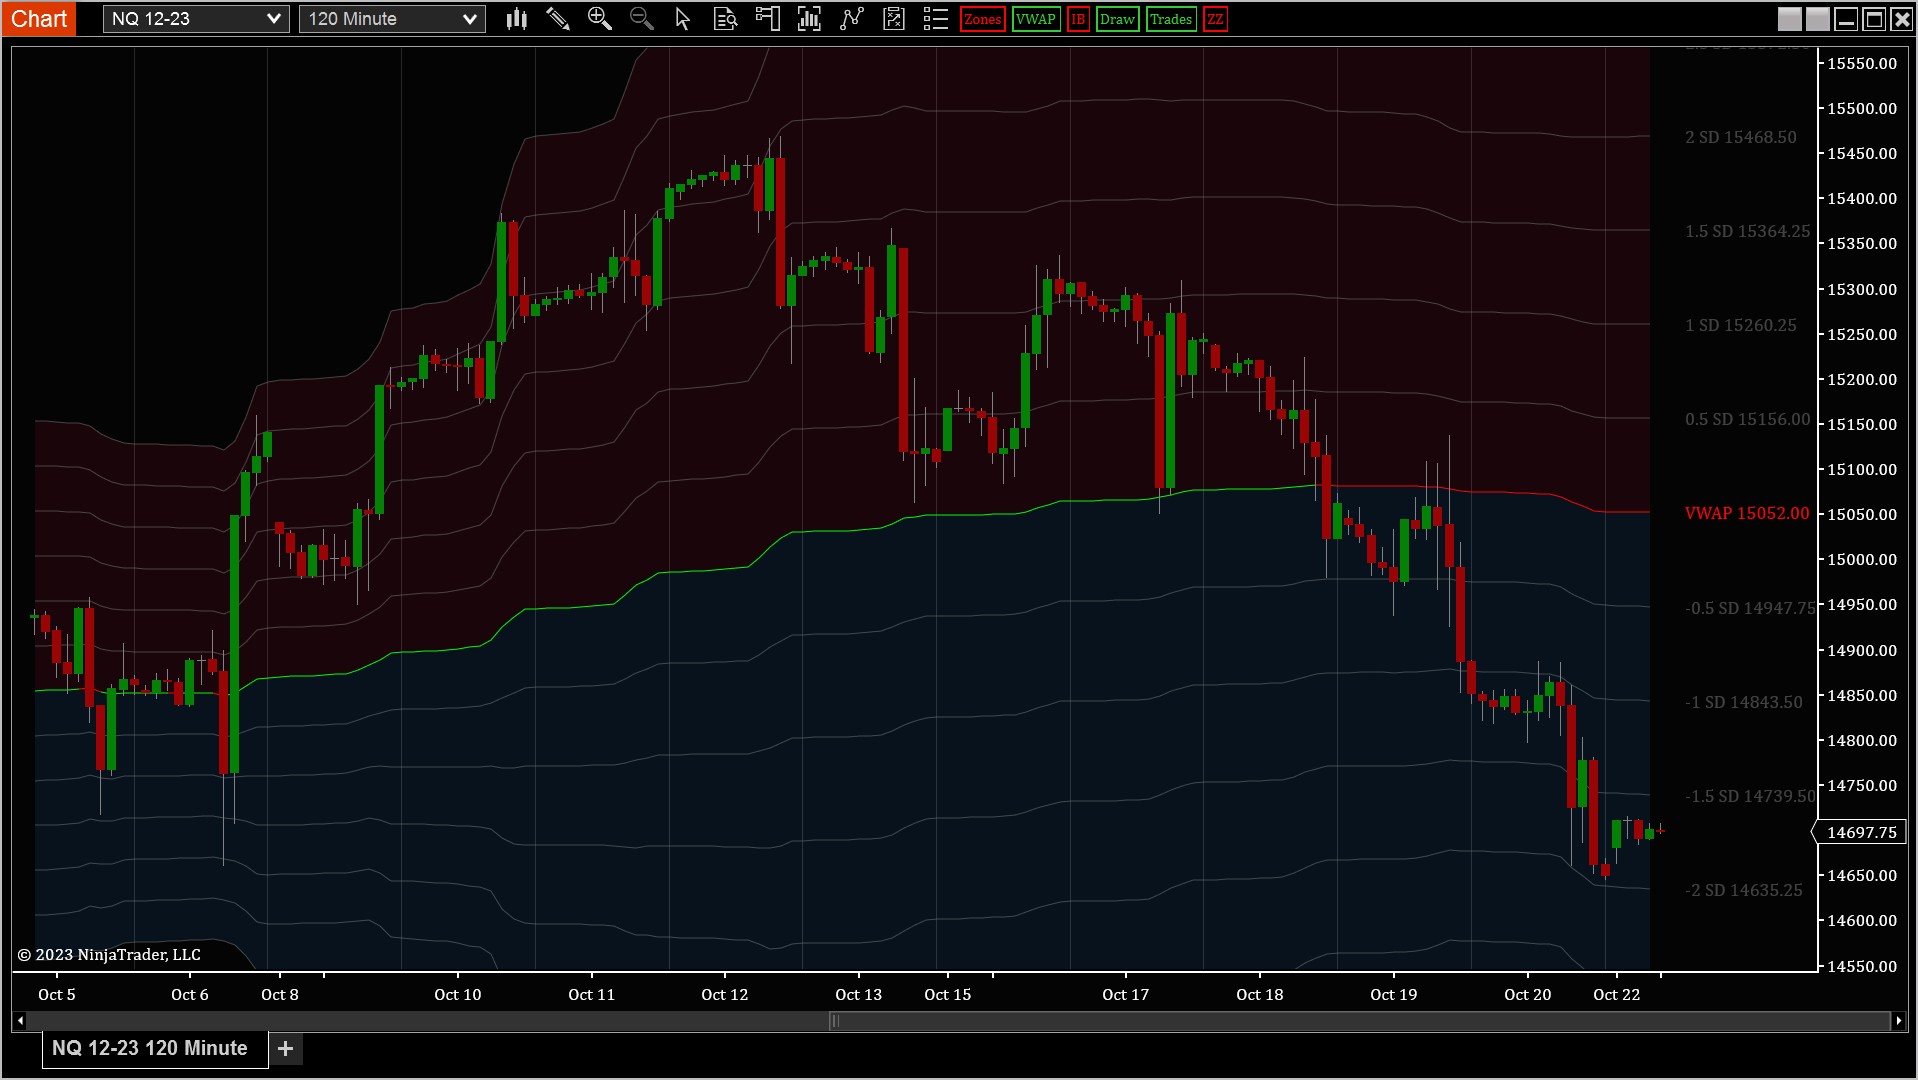
NQ 120Min

Engulfing Bars – Ultimate Zones
NQ 60Min

