


Description
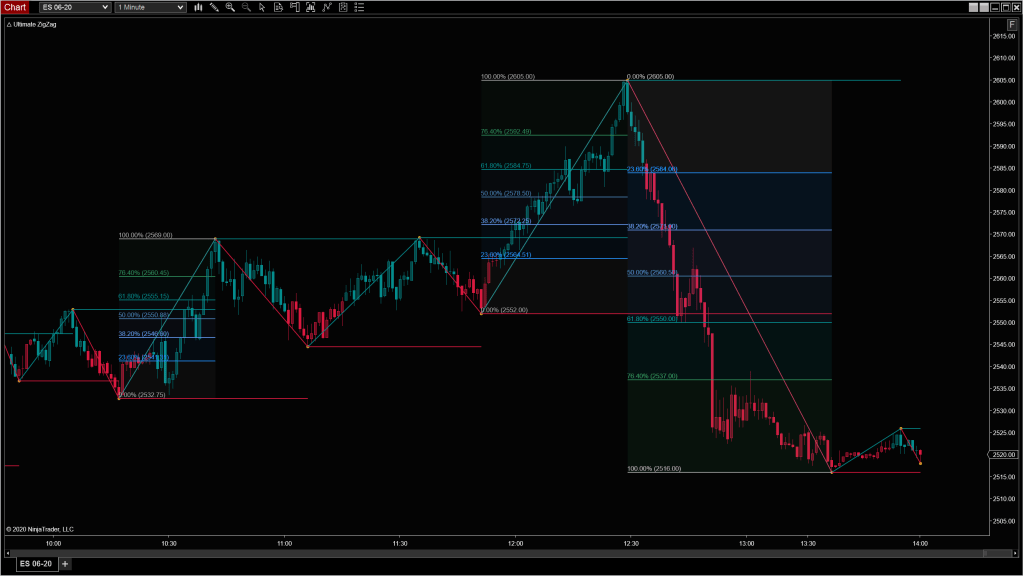
Ultimate ZigZag is more than a basic high-low connector. It reads the structure of the market by plotting swings, reversal zones, and trend changes, complete with statistics like range, volume, and bar count.
It also gives you visualization tools like Fibonacci levels, swing extensions, and real-time trail lines that help you anticipate where the next move might begin.
Tip: Use this to study how swings develop. Are they symmetrical? Is each leg gaining or losing momentum? The answers give you context that pure candles can’t.
Advanced Market Structure & Swing Detection
Color Configuration
- Color Source: Price Action (HH/HL, LH/LL, DT/DB), Trend-based, or Solid
- Visuals: Display Dots, ZigZag Line, Reversal Line, and Trail Line
- Reversal Line: Based on extremes of last X bars
- Trail Line: Real-time path of upcoming potential reversals
Additional Visual Tools
- Gap Line: Connect or break trail when price shifts
- Channel Lines: Connect swing highs/lows
- Swing Extensions: RX1–RX5 or Naked (extend until broken)
Fibonacci Drawing
Automatically draw Fibonacci levels once swing meets a defined size
Statistics Display
Display key data at pivot points:
- Price Action Type
- Price
- Range (Ticks, Points, or %)
- Volume
- Bar Count
- Time Stamp
💡 Combines precision structure analysis with rich data overlays to guide trend and reversal trades.
