
Description
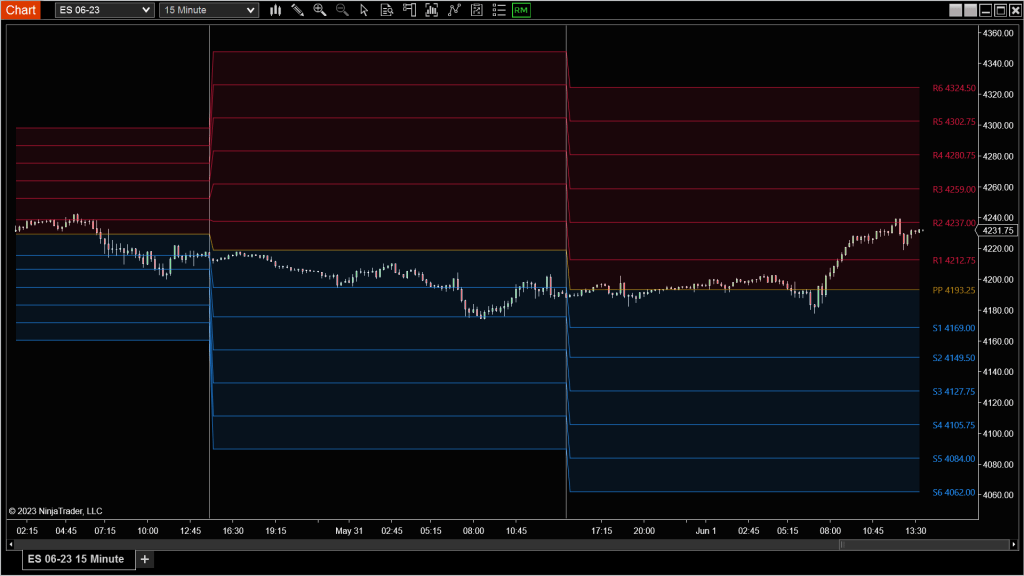
The Pivot Range is a time-tested framework that maps out potential support and resistance zones using price relationships from previous sessions. This tool automatically calculates key pivot levels (R1–R6, S1–S6) and builds envelopes around them based on your preferred input method — giving you a structured roadmap for intraday, weekly, or monthly bias.
Whether you use pivots for trade planning, directional bias, or mean reversion setups, this indicator makes them visual, flexible, and responsive to your style.
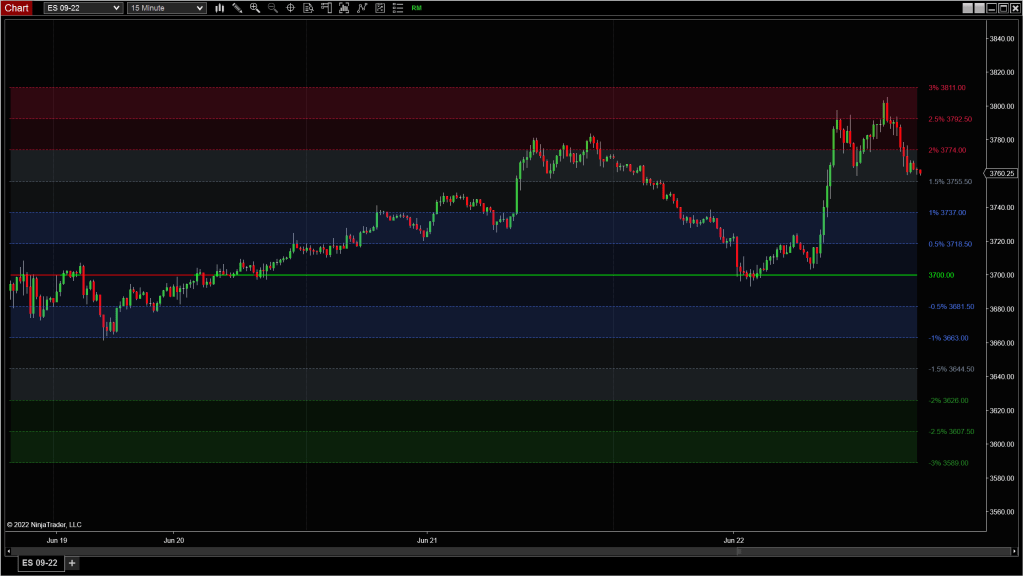
Tip: Watch how price behaves around the central pivot range. Holding above the range suggests strength, while rejection from it often signals fading pressure or a failed breakout.
Settings Overview
Price Type
Choose the base price used to calculate pivot levels and envelope zones:
- Pivots: Classic R1–R6 and S1–S6 levels based on high, low, close
- Session_Open: Uses the session open as the anchor point
- Custom_Price: Manually enter a price to anchor the envelopes
💡Use Pivots for traditional levels. Session_Open and Custom_Price allow flexibility for personalized models.
Pivot Range Period
Select the timeframe used to generate pivots and envelopes:
- Daily – Resets every session
- Weekly – Based on last week’s high, low, close
- Monthly – For swing/position traders tracking broader bias
💡Daily pivots work well for intraday setups, while weekly/monthly pivots are ideal for multi-session confluence.
HLC Calculation Method
Control how high/low/close values are sourced:
- CalcFromIntradayData – Uses intraday bar data (more precise on short-term charts)
- DailyBars – Uses daily bar values (cleaner but less granular)
- UserDefinedValues – Manually input your own high, low, close values
💡IntradayData is more responsive for active traders. UserDefinedValues let you backtest or anchor to event-specific candles.
Envelopes
Add dynamic zones around your pivot levels:
- Enable up to 6 envelopes per direction
- Track how far price stretches from your anchor values
Value Type
Choose how envelope distances are calculated:
- Currency
- Percent
- Points
- Standard Deviations
- Ticks
