
Description
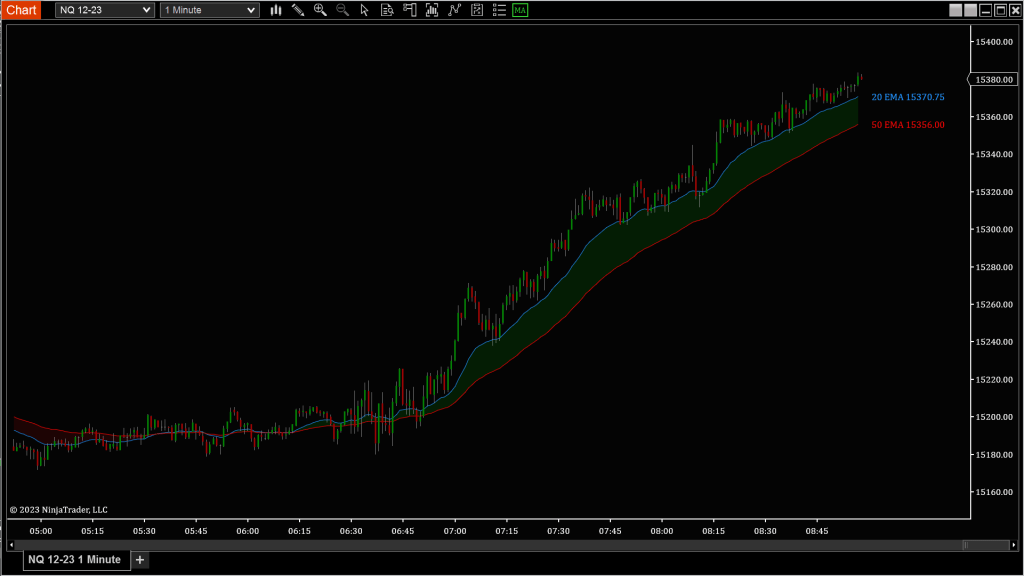
Markets often oscillate around a fair value before expanding into trend or reverting back to balance. Moving Average Bands help you visualize that relationship by plotting dynamic zones around one or two moving averages—giving you a clearer sense of whether price is stretched, balanced, or compressing.
This tool lets you customize both the timeframe and type of moving average used. Whether you’re trading pullbacks, watching for mean reversion, or trying to identify high-probability breakout zones, these bands give you structure and context. You can smooth or round the lines, apply them to ticks, volume, or range data, and compare multiple averages at once.
Tip: Watch how price behaves as it rides or rejects the outer bands. Are we hugging the upper band with rising momentum—or fading away from it into consolidation?
Custom Display Settings
Time Frame Options
Apply moving average bands to the data source that fits your strategy:
- Use Chart Bars: Matches your current chart’s bar type and size
- Minute / Seconds: Time-based data
- Tick / Volume / Range: Non-time-based movement filters
💡 Great for adapting your MA logic to scalping, swing trading, or range-bound sessions.
Line Display
Choose how price levels are rendered:
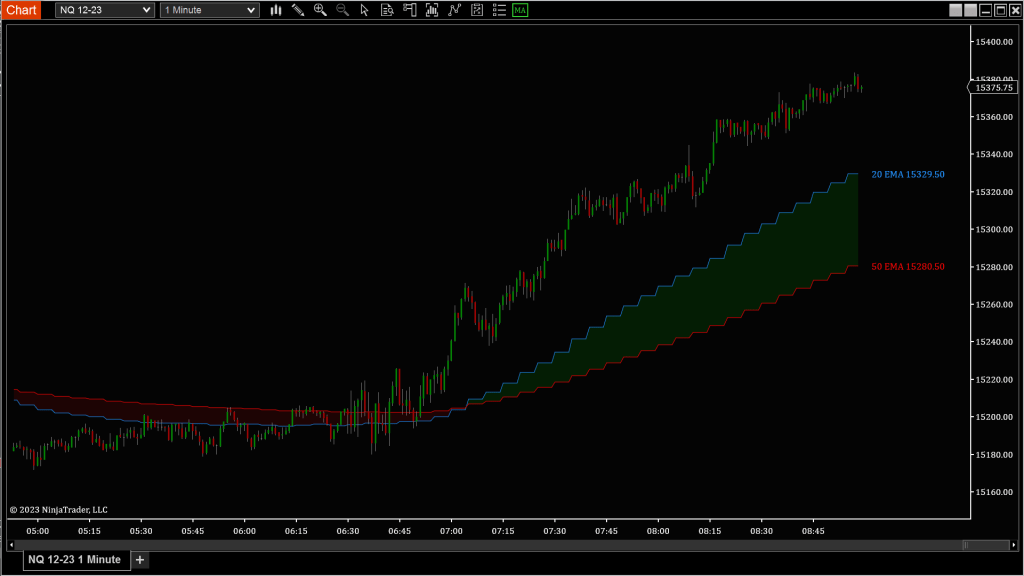
- Smooth: Plots the exact MA value (cleaner but less “grid-locked”)
- RoundToPrice: Rounds the MA to the nearest tick size (matches chart scaling)
Moving Average Types
Select from a wide range of MA algorithms to suit your style:
- EMA (Exponential Moving Average)
- HMA (Hull Moving Average)
- SMA (Simple Moving Average)
- TEMA (Triple Exponential Moving Average)
- TMA (Triangular Moving Average)
- VMA (Variable Moving Average)
- VWMA (Volume Weighted Moving Average)
- WMA (Weighted Moving Average)
You can choose two separate moving averages (Primary and Secondary) and compare their behavior over time.
💡 For trend-followers, a faster EMA and slower VWMA combo can reveal pullback entries and exhaustion zones.
