Description
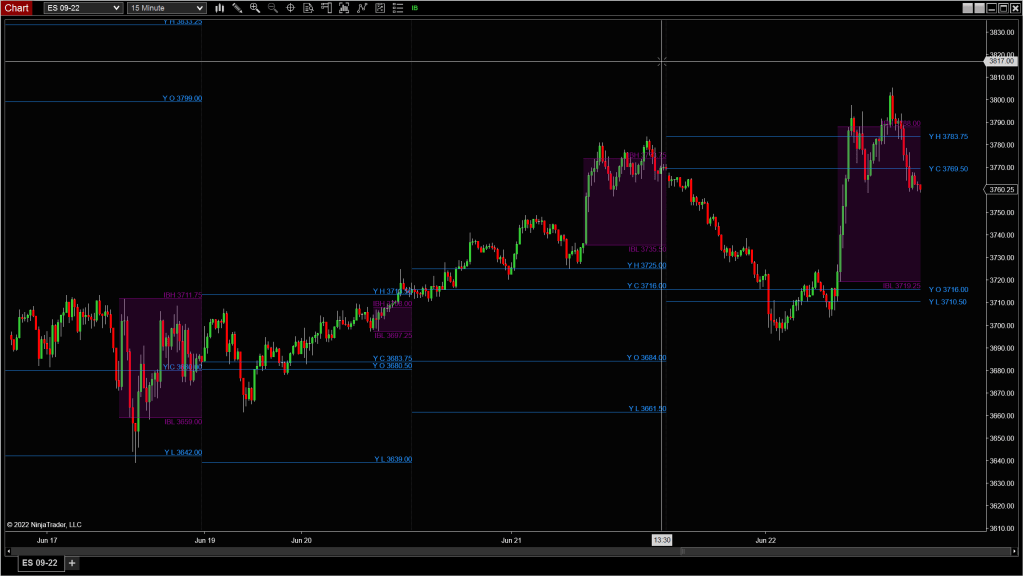
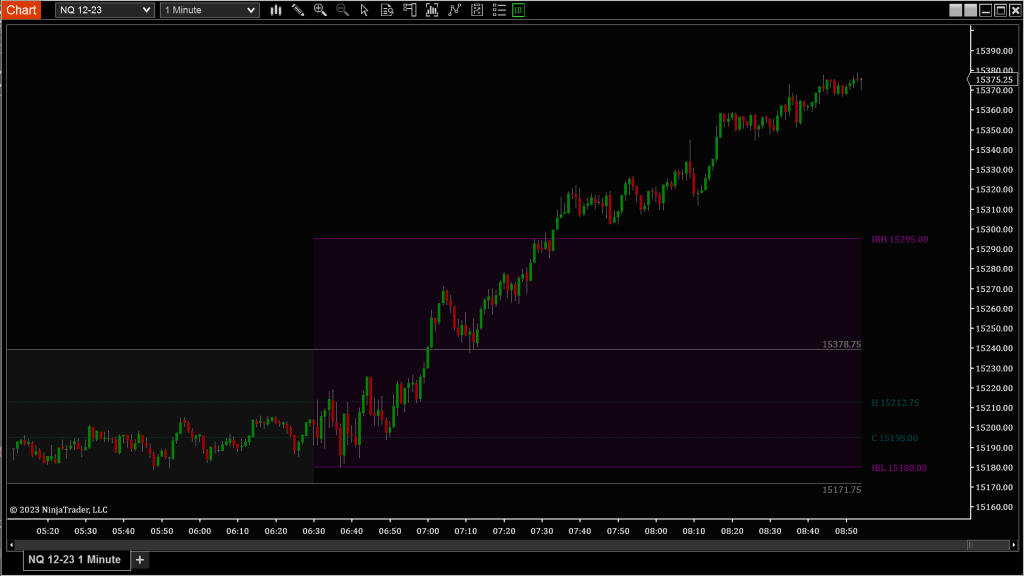
Markets respect memory. The previous day’s high, low, open, and close often serve as magnets, barriers, or pivot zones—because that’s where liquidity and trader attention cluster. The Daily Levels Tracker helps you stay anchored to that context by automatically plotting key session levels from today, yesterday, or even the prior week.
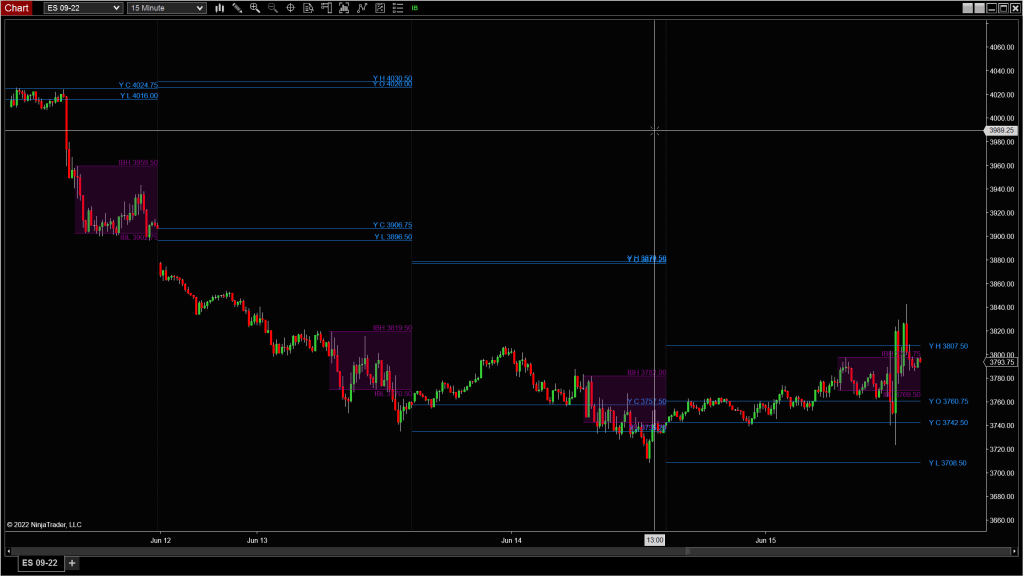
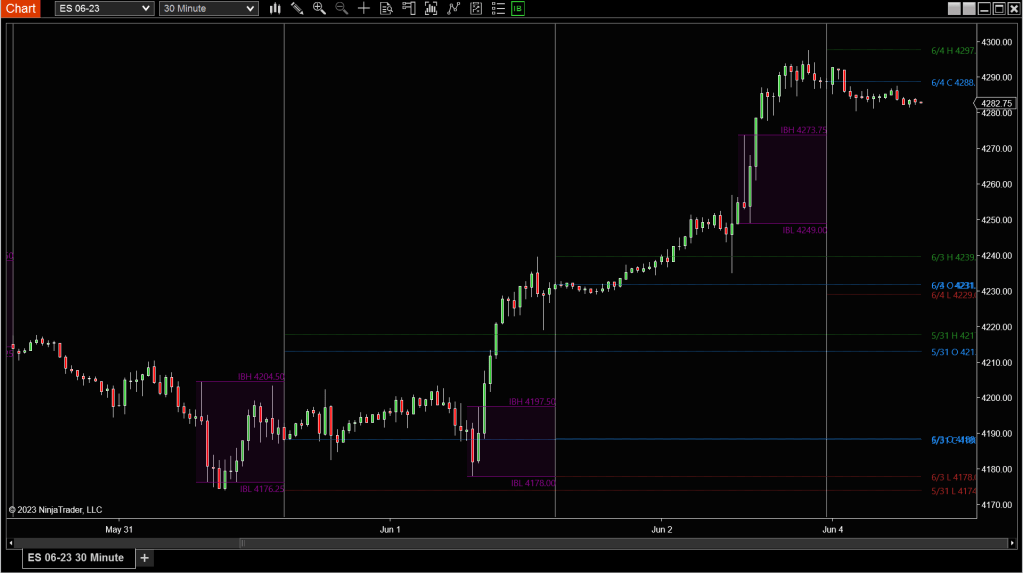
Whether you’re trading breakouts, fade setups, or mean reversion, these levels give you a sense of structure and expectation. You can also define the Initial Balance window (IB)—a critical time-based range used by many professionals to anticipate directional bias and breakout behavior.
Tip: Price failing to hold outside the IB after an initial breakout often signals a trap. Watch how it re-enters—are we rotating to the other side, or compressing for another push?
Custom Display Settings
Initial Balance (IB) Settings
Define the first range of the day that sets the tone for many traders:
- Start Time / End Time: Choose the time window to define the Initial Balance
- IB Color: Fill color for the range within this time period
- Other Color: Fill color for areas outside the IB window
- Background Type:
- Full: Covers the entire chart background
- Region: Covers just the IB range
- None: No background shading
OHLC Data Type
Select which key levels to display on your chart:
- Current Day: Displays Open, High, Low, and Mid (auto-calculated)
- Prior Day: Plots yesterday’s Open, High, Low, and Close
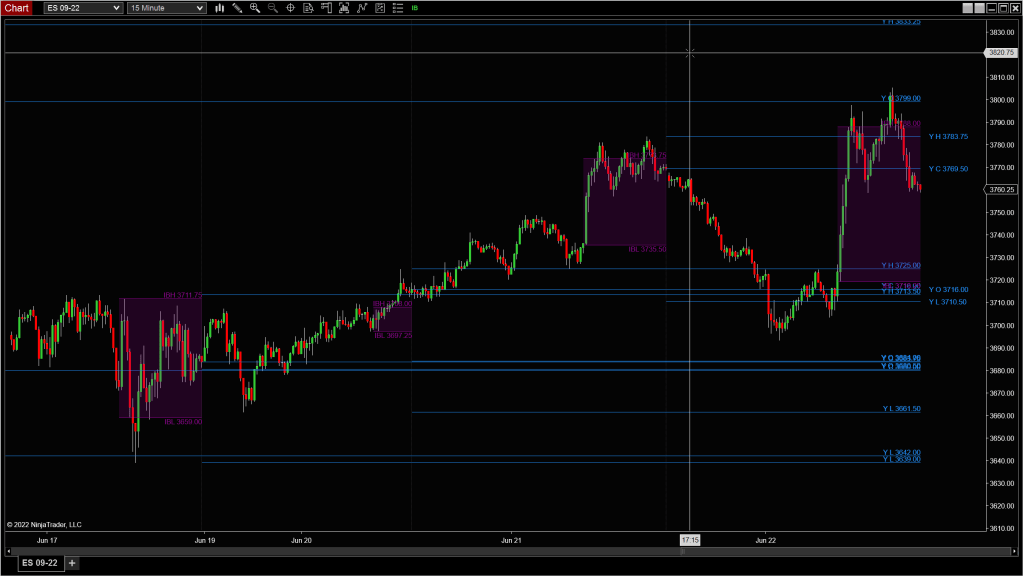
- Prior Week: Plots the same levels from the last full week
💡These levels often act as magnets or rejection points. A clean break beyond them usually signals directional intent.
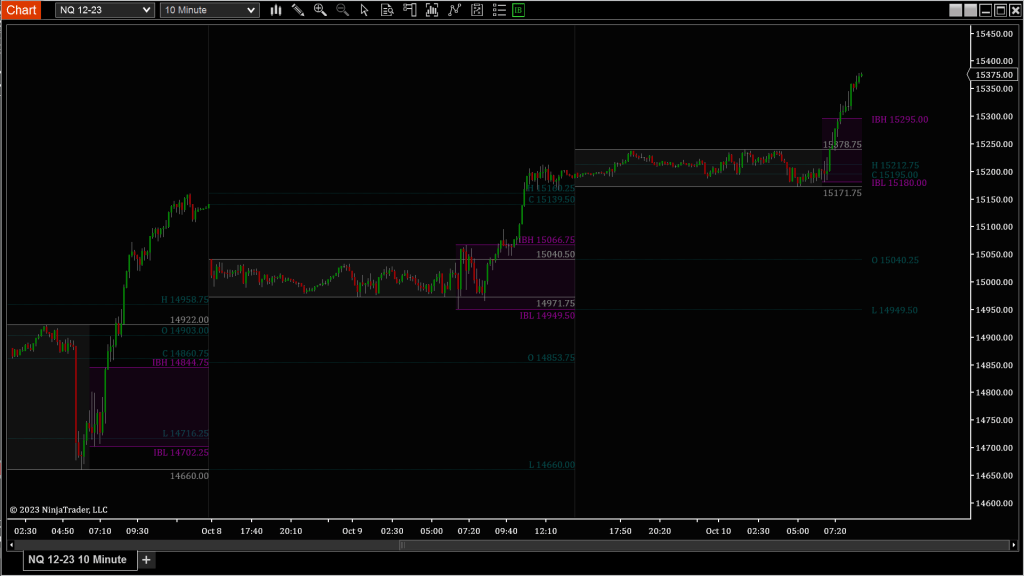
Historical Data Display
- Historical Count: Choose how many previous sessions to plot
💡Helpful for identifying multi-day stacked levels or zones that have held up over time.
Note: Make sure your chart has enough historical data loaded to calculate these levels correctly.
